Tulsa’s most dangerous roads and intersections
This page is for anyone who drives, walks or rides in Tulsa and wants to know where the worst crashes happen. It ranks the city’s roads by six years of federal fatal-crash records, adds the regional safety plan’s high-injury streets, and tells you who to call about a dangerous corner or a dead signal.
Sources re-checked .
Short answer
In federal fatal-crash records for 2019 to 2024, I-44 and I-244 had the most fatal crashes inside Tulsa, and East Admiral Place led the city streets. No official source ranks Tulsa intersections by all crashes, but INCOG’s regional plan names high-injury corridors such as East 71st Street and Sheridan Road. Report a dead signal or a dangerous corner through Tulsa311.
NHTSA: Fatality Analysis Reporting System (FARS); INCOG: Local Roads Safety Action Plan (PDF); City of Tulsa: Contact the City (Tulsa311)
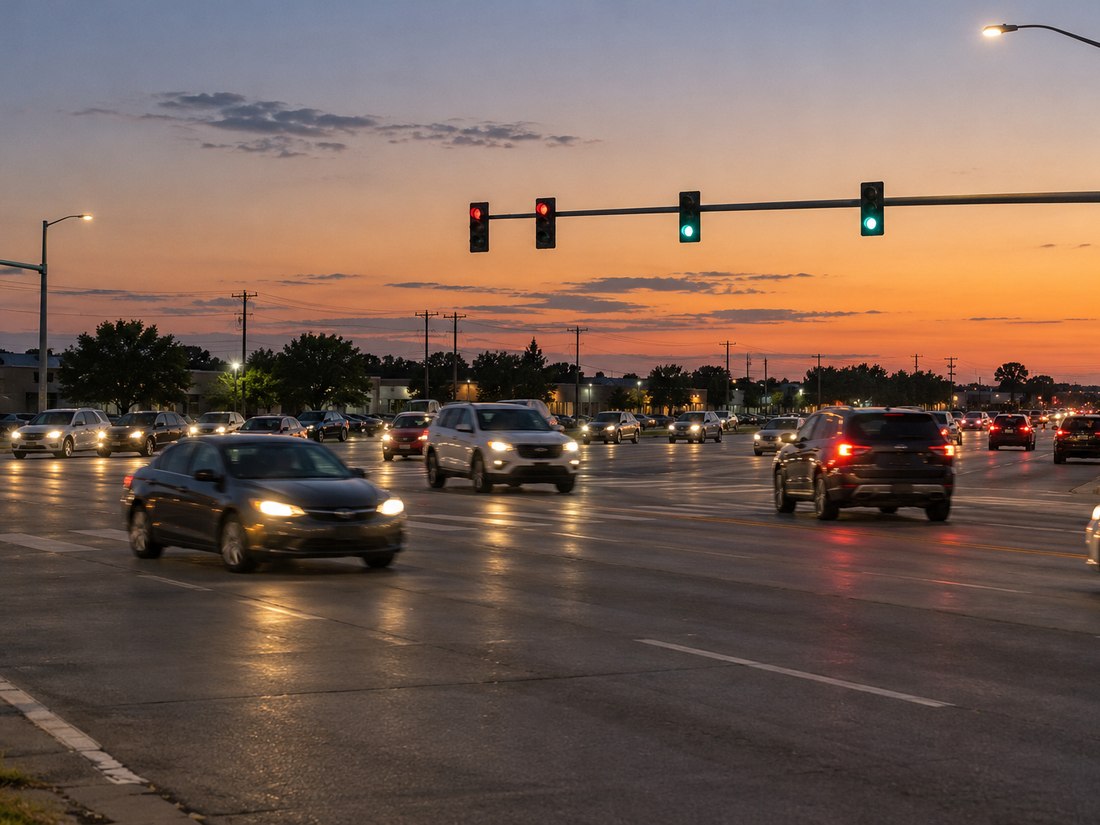
Which Tulsa roads have the most fatal crashes?
We counted every NHTSA Fatality Analysis Reporting System (FARS) record for a crash inside Tulsa city limits from 2019 through 2024, the newest full year NHTSA has released. Our count comes to 353 fatal crashes and 380 people killed. FARS takes in only crashes where someone died within 30 days, so the table below ranks the roads where people were killed. It is not a count of every wreck.
| Road | Fatal crashes | Deaths |
|---|---|---|
| I-44 | 26 | 28 |
| I-244 | 22 | 26 |
| US-169 | 16 | 20 |
| East Admiral Place | 16 | 16 |
| South Yale Avenue | 14 | 15 |
| US-75 | 13 | 14 |
| Riverside Drive | 8 | 8 |
| South Sheridan Road | 8 | 8 |
| East 31st Street | 8 | 8 |
| East 21st Street | 7 | 10 |
| East 11th Street | 7 | 9 |
A crash where two of these roads meet counts for both. FARS lists North Yale Avenue (6 more fatal crashes) and East 31st Street South (5) as separate names, so they are not added to the rows above.
Four of the top six are interstates or U.S. highways, yet city streets carried most of the toll: FARS assigns 231 of the 353 crashes to roads owned by the city and 115 to state highways. By year, the count climbed from 36 fatal crashes in 2019 to 70 in 2021, held at 63 in 2022 and 70 in 2023, and fell to 58 in 2024.
Source: NHTSA: Fatality Analysis Reporting System (FARS); NHTSA: FARS data files, 2019-2024 (our count, Tulsa city limits); NHTSA: Pedestrians, 2023 data (FARS covers deaths within 30 days).
Which intersections had repeat fatal crashes?
Over the same six years, only four named intersections had two fatal crashes each, and three of them are on East Admiral Place:
- East Admiral Place at the US-169 exit ramp
- East Admiral Place at North Utica Avenue
- East Admiral Place at North Hudson Avenue
- East 46th Street North at North Lewis Avenue
We also grouped the FARS crash coordinates to find places where three fatal crashes happened within 150 meters (about 500 feet) of each other. Five showed up:
- US-169 at East Admiral Place, on the highway and its exit ramp: three crashes, three deaths (2019, 2020, 2023). map
- East Admiral Place at North Hudson Avenue: three crashes, three deaths (2021, 2021, 2022). map
- One spot on I-244: three crashes, five deaths (2022, 2023, 2023). map
- One spot on US-75: three crashes, three deaths (2021, 2022, 2024). map
- One spot on US-75 and I-244: three crashes, three deaths (2020, 2021, 2023). map
Most of the deaths did not happen at an intersection at all. FARS places 210 of the 353 fatal crashes away from any junction, 67 inside an intersection and 29 more that were intersection-related.
Source: NHTSA: Fatality Analysis Reporting System (FARS); NHTSA: FARS data files, 2019-2024 (our count and clustering).
What about all crashes, not only deadly ones?
We looked for an official ranking of Tulsa intersections by every crash, injuries included. The City of Tulsa does not publish one that we could find and verify. The closest official list comes from INCOG, the regional council of governments, in its Local Roads Safety Action Plan adopted on October 14, 2025. It ranks stretches of road rather than single corners, by crashes from 2017 to 2021 that killed someone or caused a serious or minor injury, which planners call KAB crashes.
The plan finds that a small slice of road carries most of the harm: “The resulting HIN for the INCOG LRSAP consists of 1.5% of the total road network in the region while capturing 53.7% of fatal, severe injury, and possible injury crashes and 59.6% of fatal crashes.” HIN is its high-injury network. Its Tulsa County top ten, drawn from the local road network, lists nine corridors in Tulsa:
| Corridor | Section | KAB crashes, 2017-2021 | Crash rate ratio |
|---|---|---|---|
| East Virgin Street | Peoria Ave to Xanthus Ave | 15 | 12.1 |
| South Elgin Avenue | 8th St to 2nd St | 17 | 6.6 |
| West Haskell Place | Denver Ave to MLK Jr Blvd | 5 | 6.2 |
| Sheridan Road | Pine St to 15th St | 99 | 5.5 |
| East 71st Street | Memorial Dr to 193rd E Ave (into Broken Arrow) | 337 | 4.9 |
| East 46th Street North | MLK Jr Blvd to Lewis Ave | 27 | 4.9 |
| East Pine Street | Peoria Ave to State Hwy 11 | 111 | 4.7 |
| South Lewis Avenue | Skelly Dr to 61st St | 85 | 4.6 |
| East 8th Street | Elgin Ave to Cheyenne Ave | 15 | 4.4 |
A ratio above 1.0 means a worse crash history than roads of the same class, traffic and setting. In the plan’s words, “Most of these segments are concentrated within Tulsa city limits.” Sheridan Road and East 46th Street North appear in both records; the corner of 46th and Lewis had two fatal crashes. East Admiral Place, the city street with the most fatal crashes, is not on this list, which ranks crash rates for each type of road rather than raw totals. With injuries counted, the plan puts intersections first among crash factors: “Intersection-related crashes are the top leading factor in the INCOG region, accounting for 32.3% of crashes”, against 24.7% statewide.
To check one intersection, open the crash heat maps on the Safe Streets and Roads for All page for Tulsa, linked from the City’s Engineering Services page. They use ODOT crash data through 2021. For 2017 to 2021 the plan counts 263 traffic deaths in the city of Tulsa, 12.7 a year per 100,000 residents.
Source: INCOG: Local Roads Safety Action Plan, adopted October 14, 2025 (PDF); Safe Streets and Roads for All: City of Tulsa page and crash heat maps; City of Tulsa: Engineering Services.
What Tulsa’s fatal crashes have in common
People on foot. Pedestrians were 106 of the 380 people killed, 28 percent, and another 11 were on bicycles. Nationally, NHTSA’s 2023 fact sheet puts pedestrians at 18 percent of all traffic deaths.
Darkness. 215 of the 353 fatal crashes happened in the dark, 98 of them where the road had no lighting. The hours from 6 p.m. to midnight had 132, more than any other six-hour block. Clear skies covered 254 crashes and rain only 18. Nationally, NHTSA counts 77 percent of 2023 pedestrian deaths in the dark. It tells drivers to look for people on foot everywhere, especially at dusk, dawn and night, and to slow down and be ready to stop when turning.
Seat belts. FARS lists 260 drivers and passengers killed, and 91 of them wore a lap-and-shoulder belt. Another 150 fall under the code None Used/Not Applicable, which also covers motorcycle riders. In our count, 73 of the 150 were on motorcycles, leaving 77 people in cars, pickups and other vehicles with no restraint recorded. NHTSA estimates that lap-and-shoulder belts cut the risk of death for front-seat occupants by 45 percent in cars and 60 percent in light trucks. The Oklahoma Highway Safety Office puts it this way: “Wearing a seat belt is the #1 most effective way to prevent serious injuries and death from car crashes.” Oklahoma’s seat belt law, 47 O.S. 12-417, covers the driver and the front-seat passenger. Fine and court costs together cannot exceed $20, and the ticket adds no points to your record.
Source: NHTSA: Fatality Analysis Reporting System (FARS); NHTSA: Pedestrians, 2023 data (PDF); NHTSA: Occupant Protection in Passenger Vehicles, 2023 data (PDF); Oklahoma Highway Safety Office: Seat belts; Oklahoma Statutes, Title 47, section 12-417 (PDF).
What the city, INCOG and ODOT are doing about it
Signals and crossings on city streets. In 2022 INCOG won a $21.2 million federal Safe Streets and Roads for All grant on behalf of six local governments, the City of Tulsa among them. With a 20 percent local match the program totals $26.5 million. For its part, the City lists battery backups that keep signals running through a power outage, flashing yellow arrows, protected left turns, new and upgraded accessible pedestrian signals, new traffic signals and striping. INCOG’s plan sets the regional target: “INCOG commits to reducing traffic fatalities and serious injuries by 50% by 2035.”
People standing near fast traffic. Since October 18, 2025, on roads with a speed limit above 25 mph, a City ordinance requires anyone stopping on a curbside sidewalk to stay at least 18 inches from the curb. Standing on narrow medians is banned, and on larger medians you must keep 18 inches from both sides. Breaking the rule can bring a citation or fine.
I-44 and US-75. ODOT’s most expensive contract to date, $252 million, is completing the I-44 and US-75 interchange, which about 150,000 vehicles pass through on a typical day, around 21,000 of them trucks. It also widens US-75 between 41st and 71st streets and replaces the US-75 interchange at 61st Street. ODOT expects to finish in summer 2028, weather permitting, and has tentatively set 2029 for widening I-44 between the I-44/I-244 western split and the Arkansas River. At the April 2025 groundbreaking, ODOT’s Tim Gatz said the project “will make the interchange function much more efficiently while also improving safety for the traveling public.”
Source: Safe Streets and Roads for All: program overview; Safe Streets and Roads for All: City of Tulsa measures; Safe Streets and Roads for All: roadway safety countermeasures; INCOG: Local Roads Safety Action Plan (PDF); City of Tulsa: Safety and Mobility Resources; City of Tulsa: Sidewalk and Median Safety Ordinance handout (PDF); ODOT: groundbreaking on the $252 million I-44/US-75 project; ODOT: work begins on the I-44/US-75 interchange.
How to report a dangerous intersection or a broken signal
On city streets, reports go to Tulsa311. File online at any hour through the Tulsa311 portal or the Tulsa311 app, call 311 inside city limits or (918) 596-2100 from outside, or email Tulsa311@cityoftulsa.org. Phone and email are staffed Monday to Friday, 8 a.m. to 5 p.m. Pick the request type that fits:
- A dark, flashing or damaged signal: Traffic Signal Malfunction. While signals are out for repair, the City tells drivers to treat those intersections as four-way stops “to ensure the safety and efficiency of traffic flow.” If a wreck or a downed pole is blocking the road, that is an emergency: call 911.
- A missing or knocked-down sign or street name: Traffic Sign/Street Marker.
- A corner that needs a study, such as a turn arrow, a crosswalk or a new signal: Traffic Request, the portal’s traffic engineering form. You can also drop a comment on the Safe Streets program’s countermeasure input map, which invites residents to flag a location and suggest a fix.
- Speeders on your residential street: the Neighborhood Traffic Calming Program handles speed humps. A street must meet speed and volume criteria, and the City says the eligibility notice can take up to six weeks.
- A dark streetlight: PSO owns and maintains residential and arterial street lights, so report those to PSO online or at 888-218-3919. Freeway and highway lights belong to the City: call 311 or email Tulsa311@cityoftulsa.org.
On I-44, I-244, US-169 or US-75, the road belongs to the state. ODOT’s Tulsa County maintenance office is at 4002 N. Mingo Valley Expressway, (918) 838-9933. A pothole that damaged your car has its own process, covered in the pothole damage guide.
Source: City of Tulsa: Contact the City (Tulsa311); Tulsa311: online service requests; City of Tulsa: traffic signal repairs and four-way stops, February 2026; Safe Streets and Roads for All: Tulsa countermeasure input map; City of Tulsa: Traffic calming FAQs; City of Tulsa: Street Lighting System; ODOT: Tulsa County Maintenance.
Questions Tulsa drivers ask about dangerous roads
What is the most dangerous road in Tulsa?
By deaths, I-44: 26 fatal crashes and 28 deaths inside city limits from 2019 to 2024 in our count of NHTSA FARS records, ahead of I-244. Among city streets, East Admiral Place had the most, 16. For injury crashes on local roads from 2017 to 2021, INCOG’s plan counts 337 crashes with a death or injury on East 71st Street east of Memorial Drive.
What is the most dangerous intersection in Tulsa?
No official source we could verify ranks Tulsa intersections by all crashes. In the federal fatal records, four intersections had two fatal crashes each: Admiral Place at the US-169 exit ramp, at Utica Avenue and at Hudson Avenue, and 46th Street North at Lewis Avenue.
A traffic light is out. Who do I call?
Report a Traffic Signal Malfunction to Tulsa311, online at any hour or by calling 311 on weekdays from 8 a.m. to 5 p.m. Until it is fixed, treat the intersection as a four-way stop.
Do adults in the back seat have to buckle up in Oklahoma?
The seat belt law, 47 O.S. 12-417, covers the driver and front-seat passenger. Children have separate rules, explained in the car seat guide. NHTSA advises buckling up in the front and the back seat on every trip.
After a crash on one of these roads
The car accident guide walks through the scene, the police report and the insurance claim. If the crash leaves your car not worth repairing, the wrecked car guide covers selling it as it is, or call us at (539) 271-2021.
More on selling a car in Tulsa
- PaperworkWhat you sign, who notarizes it, the two-day deadline, and which counter in Tulsa takes it.
- Cash for carsMoney for a running, dead or junk car anywhere in Tulsa: our offer or the partner route, paid by check.
- Bill of saleWhen Oklahoma needs a bill of sale, whether it is notarized, and what goes on it.
- Repair or sellCompare repair costs with the extra sale proceeds, then check Oklahoma's salvage and rebuilt title rules.
- After you sellPlate off, the two-day filing, insurance, PikePass, and what to do if a ticket arrives for a car you sold.
- Title problemsLost the title, a lien still on record, the owner has died, or the title is from another state.